


TruPutt app for iPhone and iPad
Developer: Douglas Goeringer
First release : 31 Jan 2019
App size: 7.3 Mb
Have you wondered if the time spent practicing your putting has led to real improvement … or how your putting ability compares with a PGA TOUR professional golfer? Simply counting putts per round does not accurately answer those questions due to variations in a golfer’s round-to-round approach and pitch/chip shot precision. Significantly, Strokes Gained: Putting, one of the primary putting statistics used by golf professionals on the PGA TOUR, normalizes for first-putt distance and, therefore, is independent of how well - or poorly - approach and pitch/chip shots are hit.
Now amateur golfers can enter a new dimension in the modern statistical analysis of their own putting game by using the TruPutt app to calculate Strokes Gained: Putting values for each round … and to subsequently compare their round-to-round putting performances accurately!
Strokes Gained: Putting is based on comparison of the number of putts taken by an individual player from a specific distance versus a statistical database of the same information obtained for all PGA TOUR players. For example, the average number of strokes needed to hole a putt from 8 feet is about 1.5 for TOUR players; that is, those golfers make about 50% of their putts from that distance. Thus, if a player takes just 1 stroke to sink an 8-foot putt, Strokes Gained: Putting is (1.5 - 1) = 0.5 ; the golfer gained one-half stroke putting on that hole. On the other hand, if 2 putts are required to hole-out from 8 feet, Strokes Gained: Putting for that hole is (1.5 - 2) = - 0.5 ; therefore, the player lost one-half stroke on the hole.
Strokes Gained: Putting is cumulative, so the Total Strokes Gained: Putting for a round is simply the sum of Strokes Gained: Putting for all holes. Furthermore, Strokes Gained: Putting can be averaged by summing the values from multiple rounds and dividing by rounds played.
The concept of Strokes Gained: Putting, developed by Professor Mark Broadie of the Columbia University Business School and later refined by the PGA TOUR, is a by-product of the TOURs ShotLink Academic program.
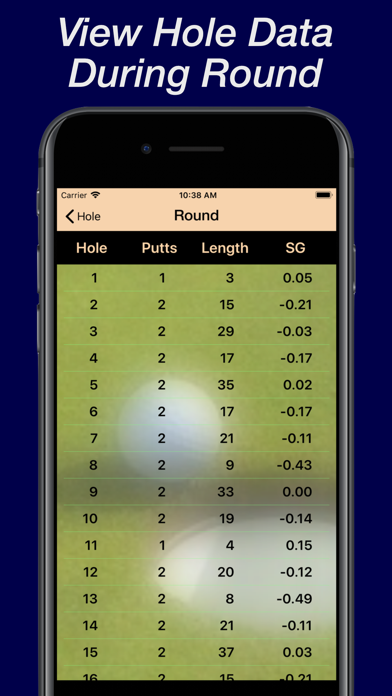
To use TruPutt, a player simply selects the Hole screen (on the tab bar) and inputs the hole number, estimated putting distance, and number of putts taken (a 5-8 second process). TruPutt then immediately calculates and displays Strokes Gained: Putting for the hole. Putting data for all holes can be reviewed by selecting the Round screen (on the navigation bar) during the round and revised if necessary. All putting data can be cleared at the start of a new round by tapping the Reset button (on the Hole screen).
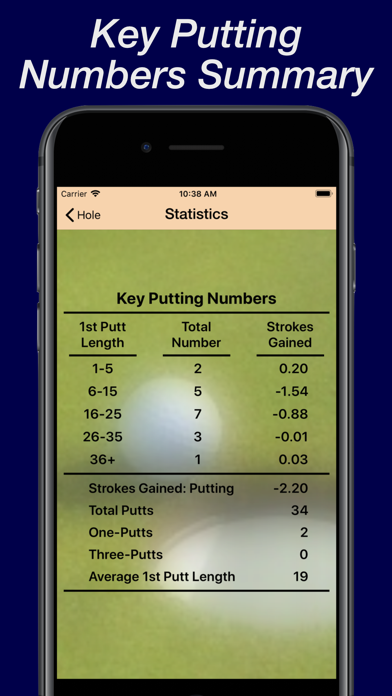
TruPutt calculates cumulative Strokes Gained: Putting for the round and five key distance ranges (1-5, 6-15, 16-25, 26-35, 36+ feet), as well as for the statistics: Total Putts, One-Putts, Three-Putts, and Average Length of First Putt. That information also can be reviewed during the round by selecting the Statistics screen (on the navigation bar).
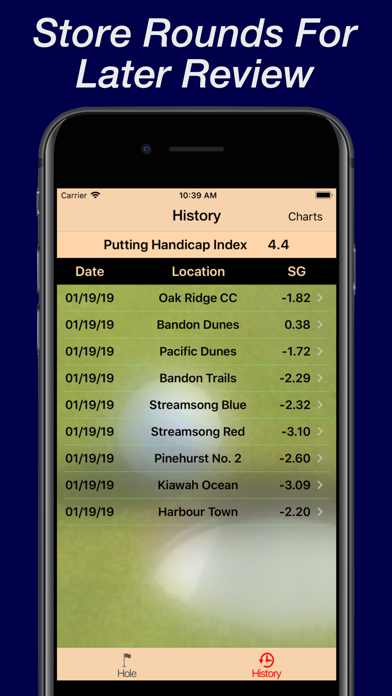
Upon completion of a round, all putting data and statistics can be saved by tapping the Store button (on the Hole screen) and entering location information (the date is automatically entered as well). Selecting the History screen (on the tab bar) displays a table of all stored rounds (date, location, cumulative Strokes Gained: Putting). Furthermore, TruPutt calculates a player’s Putting Handicap Index (shown above the table), which is based on Strokes Gained: Putting for the stored rounds. Tapping any line in the table reveals the statistics for the selected round; swiping left deletes the round.
While on the History screen, tapping Charts (on the navigation bar) allows a player to view three types of bar charts plotted using the stored round statistics: Strokes Gained: Putting vs. date, average Strokes Gained: Putting vs. distance range (1-5, 6-15, 16-25, 26-35, 36+ feet), and Strokes Gained: Putting (in increments of 0.2) vs. number of occurrences. Scrolling left/right on the selected chart reveals off-screen values.